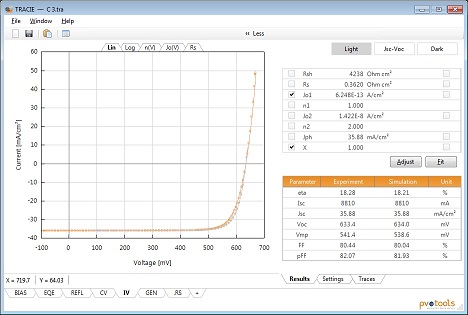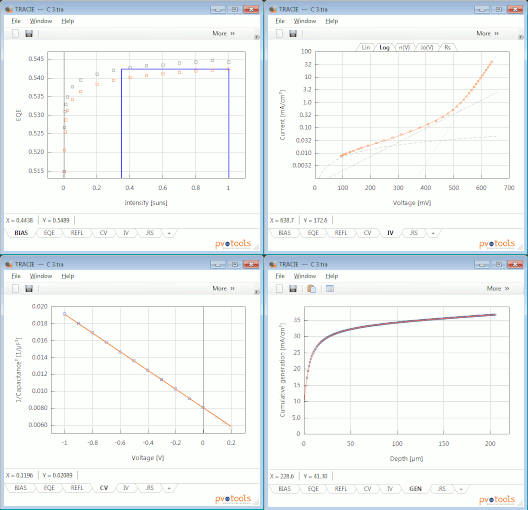

Results in 2D Graphs
TRACIE is the tool for visualizing and evaluating IV-curves, bias ramps, capacitance-voltage curves, EQE and reflectance spectra, optical generation profiles, and much more. Data-files may be re-evaluated folder-wise according to fit-recipes. TRACIE is particularly useful for comparing curves from various files, exporting averages curves with standard deviations etc. Also supported is the imported of data from the clipboard, on which you may apply linear regressions and export plots.
